A Fundação Getúlio Vargas divulgou o seu índice de incerteza econômica referente ao mês de março. O índice subiu para 167 pontos, o valor máximo da série histórica, como pode ser visto no gráfico abaixo. Nem mesmo os momentos mais tensos cobertos pelo índice, como a eleição de 2002 e a crise de 2008, chegam perto do nível de incerteza que estamos vivendo nesse momento.
library(readxl)
library(lubridate)
library(magrittr)
library(dplyr)
library(ggplot2)
library(scales)

iie = read_excel('iie.xls', skip=8) %>%
mutate(date = seq(as.Date('2000-01-01'), as.Date('2020-03-01'),
by='1 month')) %>%
select(date, '1')
colnames(iie) = c('date', 'value')

ggplot(iie, aes(x=date, y=value))+
annotate("rect", fill = "lightblue", alpha = 0.7,
xmin = as.Date('2002-06-01'),
xmax = as.Date('2002-12-01'),
ymin = -Inf, ymax = Inf)+
annotate("rect", fill = "lightblue", alpha = 0.7,
xmin = as.Date('2008-06-01'),
xmax = as.Date('2009-01-01'),
ymin = -Inf, ymax = Inf)+
annotate("rect", fill = "lightblue", alpha = 0.7,
xmin = as.Date('2020-01-01'),
xmax = as.Date('2020-04-01'),
ymin = -Inf, ymax = Inf)+
annotate("rect", fill = "lightblue", alpha = 0.7,
xmin = as.Date('2015-06-01'),
xmax = as.Date('2015-10-01'),
ymin = -Inf, ymax = Inf)+
geom_line(size=.8)+
scale_x_date(breaks = date_breaks("1 year"),
labels = date_format("%Y"))+
theme(axis.text.x=element_text(angle=45, hjust=1),
plot.title = element_text(size=10, face='bold'))+
labs(x='', y='Índice',
title='Índice de Incerteza Econômica da FGV',
caption='Fonte: analisemacro.com.br com dados da FGV')
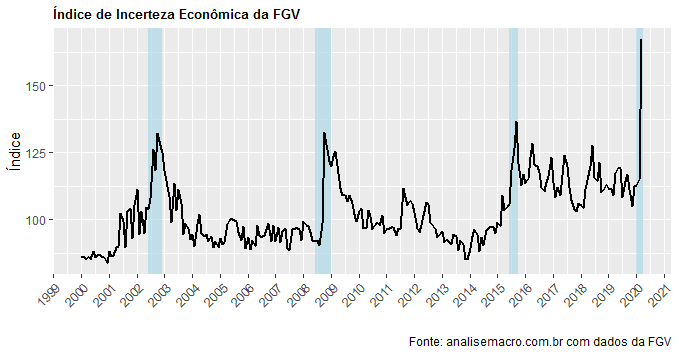
Não há paralelo, que seja coberto pelos dados, com o que estamos vivendo.
(*) Isso e muito mais você aprende em nossos Cursos Aplicados de R.
___________