[et_pb_section admin_label="section"][et_pb_row admin_label="row"][et_pb_column type="4_4"][et_pb_text admin_label="Texto" background_layout="light" text_orientation="justified" text_font="Abel||||" text_font_size="19" use_border_color="off" border_color="#ffffff" border_style="solid"]
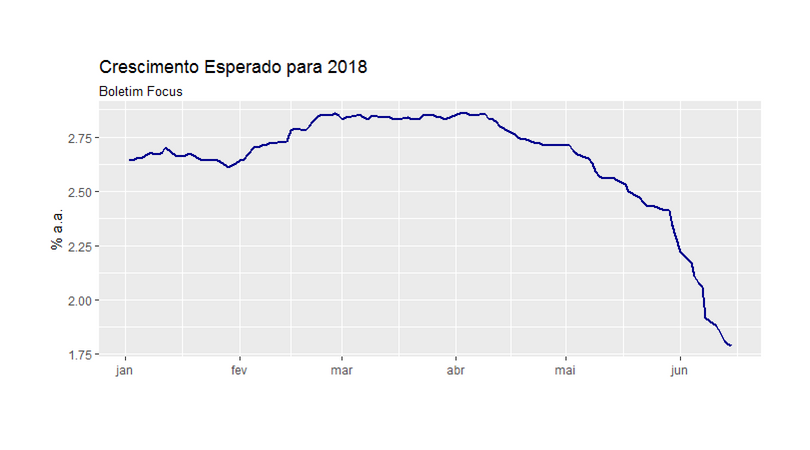
Com a versão 0.1.4 do pacote rbcb, produzido pelo meu colega Wilson Freitas, já é possível baixar dados de expectativas do boletim Focus. Abaixo, um exemplo:
library(rbcb)
library(ggplot2)
pibe = get_annual_market_expectations('PIB Total',
start_date = '2018-01-02')
pib_esperado = pibe$mean[pibe$reference_year=='2018']
dates = pibe$date[pibe$reference_year=='2018']

data = data.frame(dates=dates, pib=pib_esperado)

ggplot(data, aes(dates, pib))+
geom_line(size=.8, colour='darkblue')+
labs(title='Crescimento Esperado para 2018',
subtitle='Boletim Focus')+
xlab('')+ylab('% a.a.')
[/et_pb_text][/et_pb_column][/et_pb_row][et_pb_row admin_label="row"][et_pb_column type="4_4"][et_pb_image admin_label="Imagem" src="https://analisemacro.com.br/wp-content/uploads/2017/11/cursosaplicados.png" show_in_lightbox="off" url="https://analisemacro.com.br/cursos-de-r/" url_new_window="off" use_overlay="off" animation="off" sticky="off" align="center" force_fullwidth="off" always_center_on_mobile="on" use_border_color="off" border_color="#ffffff" border_style="solid"]
[/et_pb_image][/et_pb_column][/et_pb_row][/et_pb_section]


